Data Explorer
The challenge: How to make data accessible to non-technical teams without relying on IT support?
Scope of Work
A thoughtful application design process
↓ Research
Market analysis, problem identification, goal definition, forecasting, competition analysis, user surveys, persona creation, empathy mapping
↓ UX Design
User journeys, information architecture, flow maps, functional wireframes
↓ UI Design
Color palette, typography, brand style, interface components
↓ Project Review
Key elements, aesthetics, functionality
↓ Testing
A/B testing, high-fidelity prototypes, final conclusions
Problem
Non-technical teams such as PM, R&D, and Regulatory had limited access to product data. They were unable to independently build queries or search through data without IT support. This caused delays, errors, duplicated work, and inconsistent analysis outcomes.
The need
To design a tool that supports intuitive data exploration without requiring SQL skills. It should allow users to save, validate, and share queries within a friendly interface that promotes autonomy and improves consistency.
My role
I was responsible for defining the problem and designing the Data Explorer application. Through user research, testing, and UX design, I created a solution that enables non-technical users to work effectively with data without technical barriers or BI team involvement.
1. Project goal
The organization needed a solution that would let non-technical users such as PMs, R&D, and Regulatory teams explore product data and build complex queries. These queries should be easy to save and share within the team, without requiring SQL knowledge or IT assistance.
2. Research and requirements definition
Research methods
- Five in-depth interviews with end users
- Observations of workflows using Excel and manual filtering
- Analysis of seventeen real-life query examples from spreadsheets and emails
Key user needs
- An intuitive interface for filtering data
- Ability to build complex logic using AND and OR
- Options to save and share queries
- Query history and version control
- Validation before running a query
Insights
- The absence of a shared repository led to repeated work
- Even experienced users preferred a click-based interface
- The lack of visual feedback during query building led to errors
3. Core features and user journey
3.1 Application start and data source selection
Users open the application from the main dashboard. They can either start exploring data from scratch or load it from a project or the shared query repository.

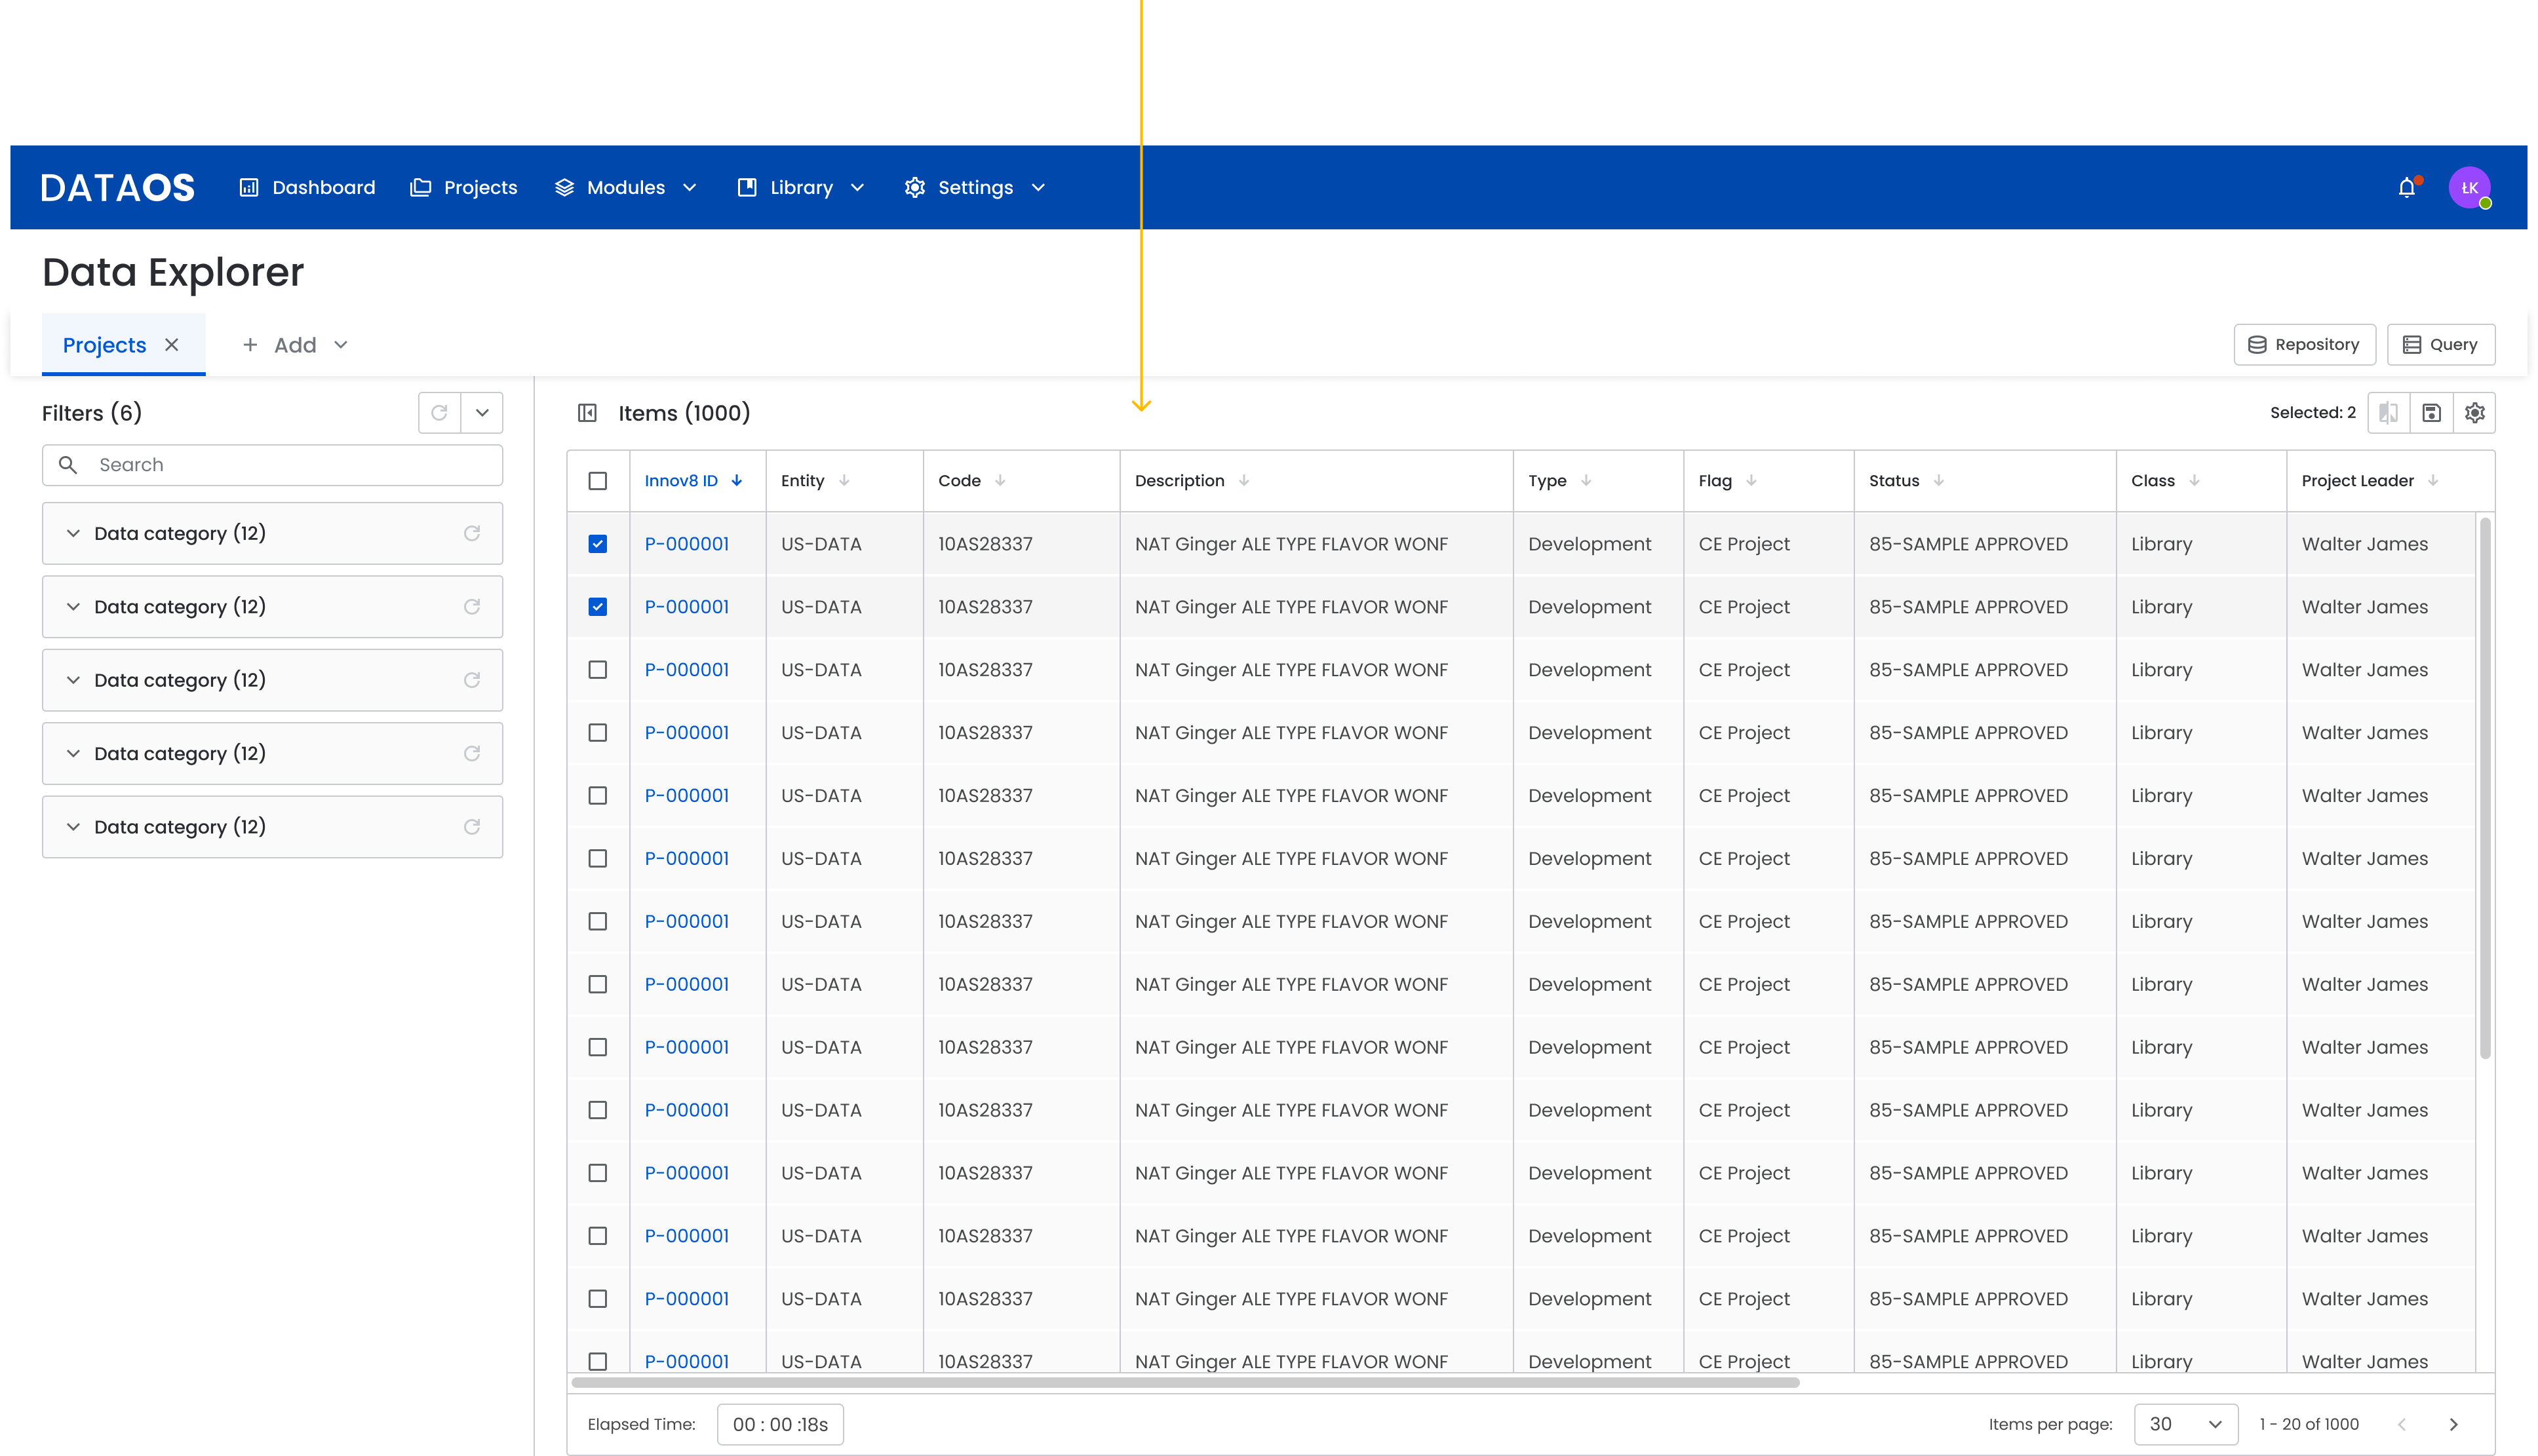
3.2 Default view (data table)
When the user opens the application, they see:
- a table with default results
- the ability to filter by columns such as Flavor Type, Status, or Project
- basic exploration tools available immediately
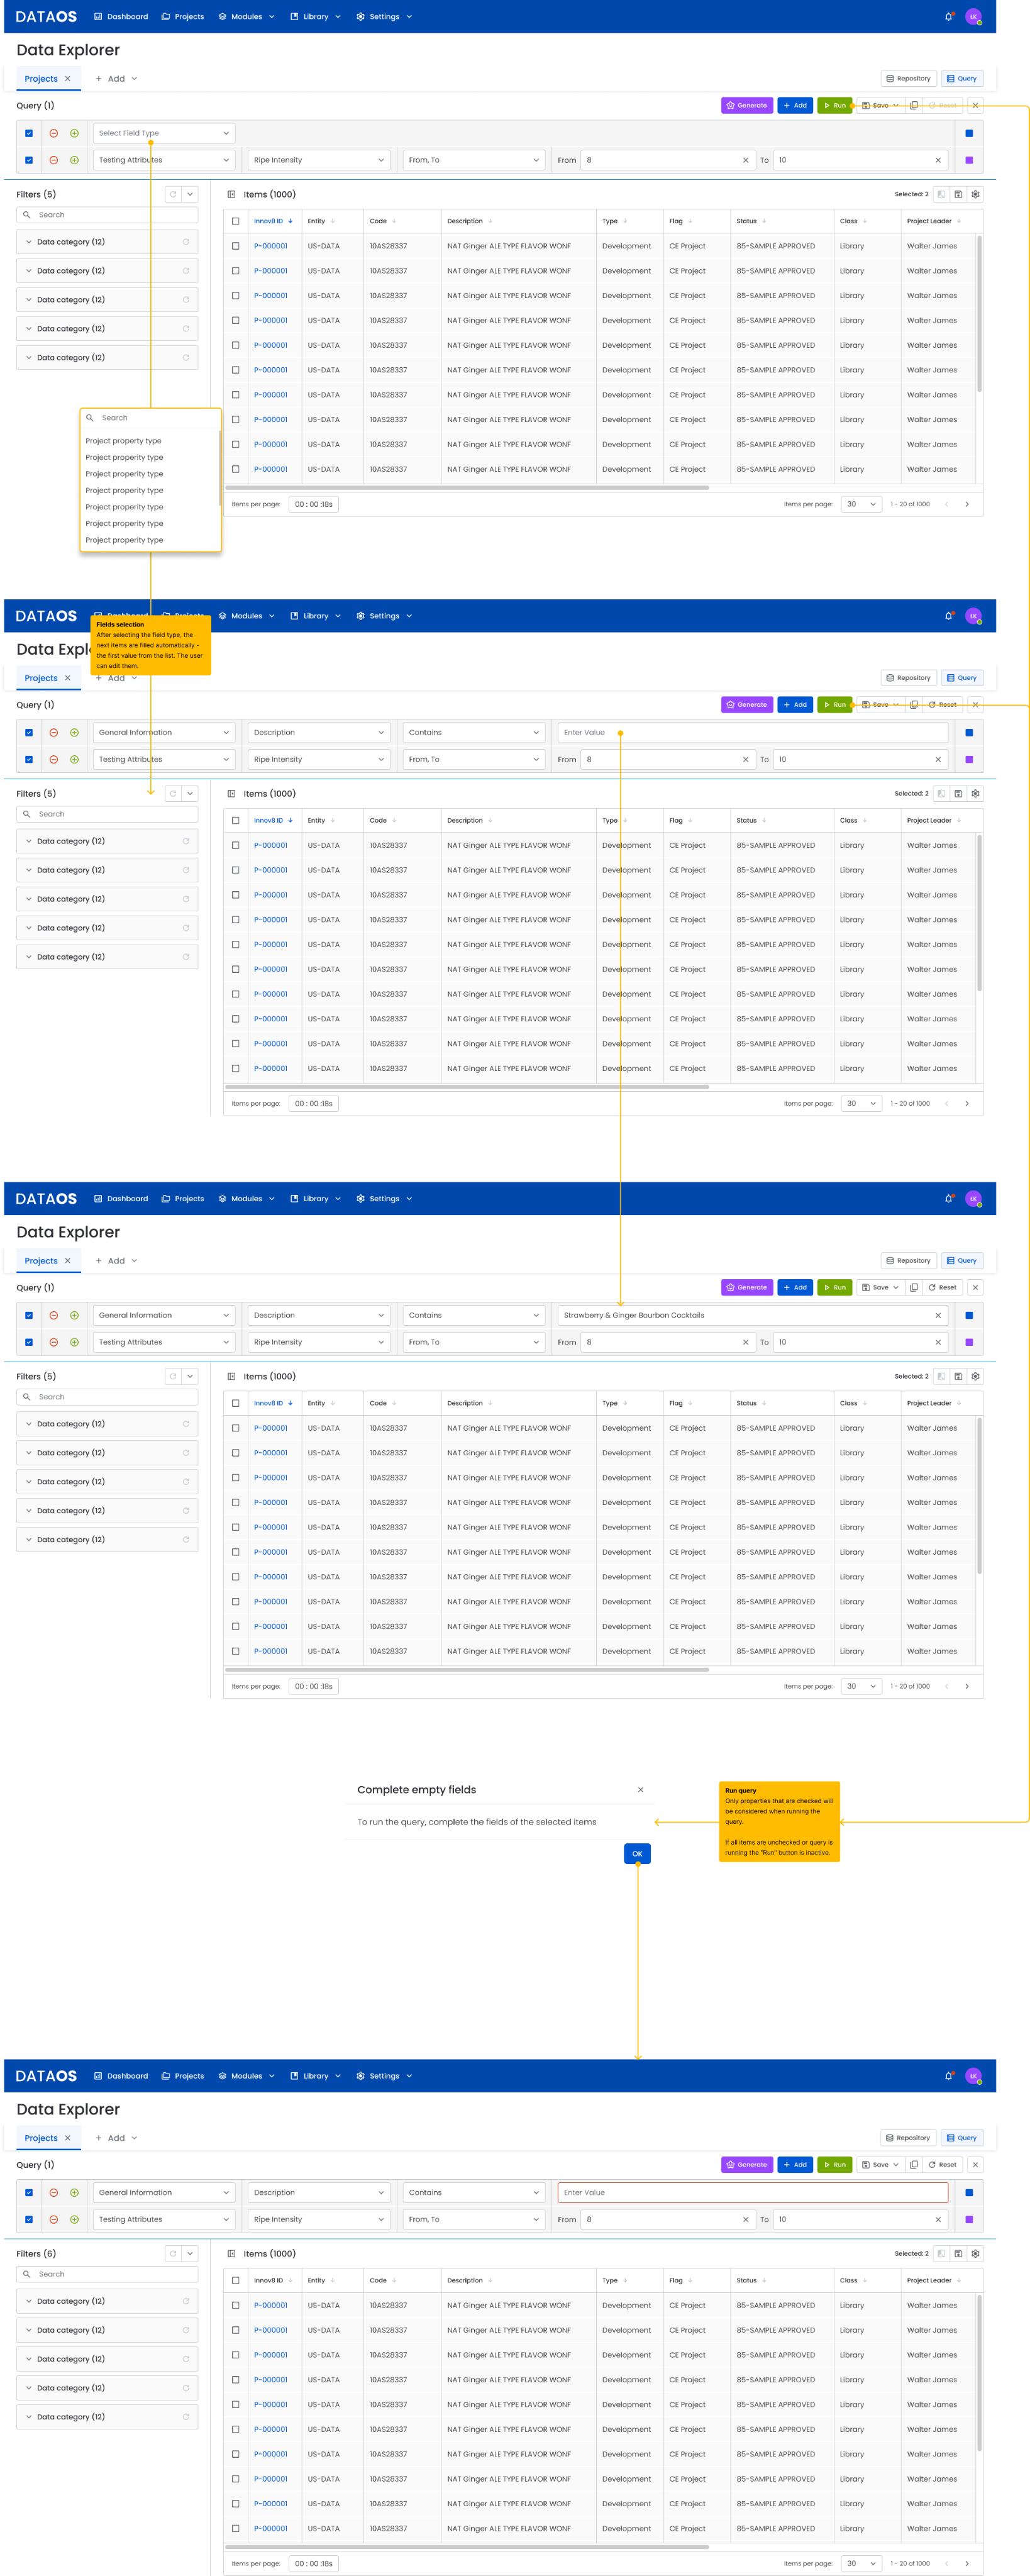
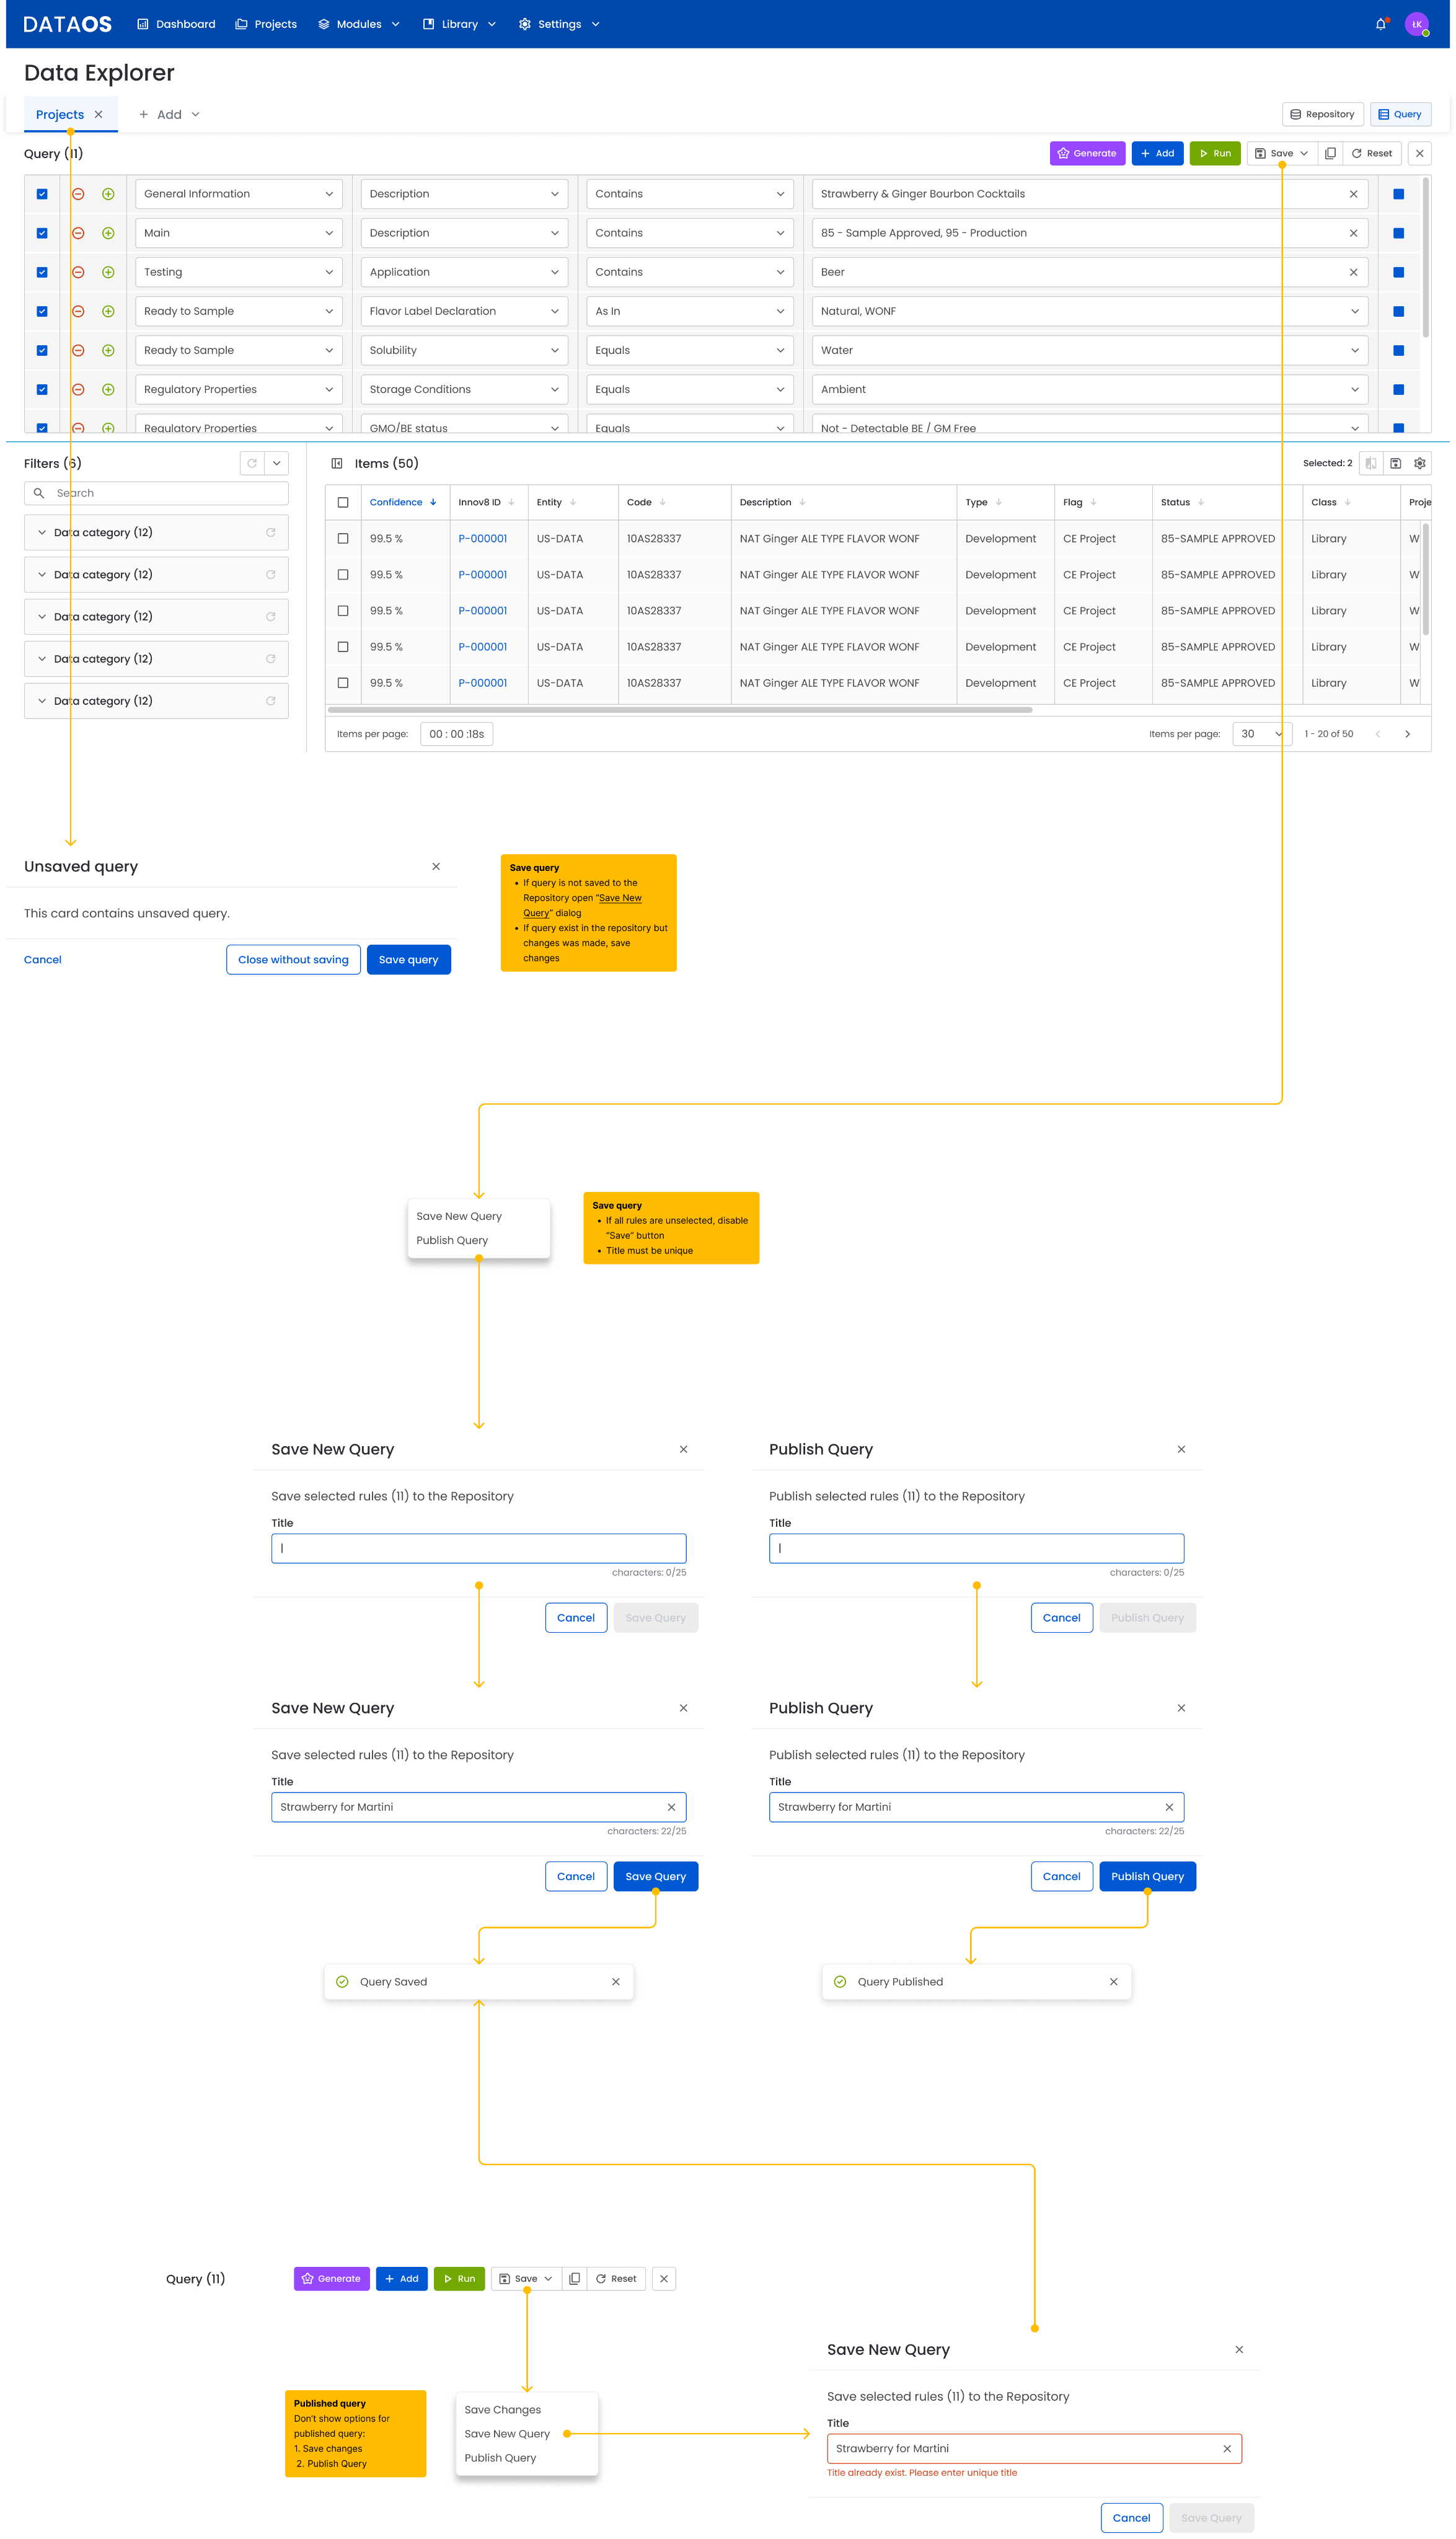
3.3 Manual query creation
The user clicks “Add Query” to build a filter. Example rules include:
- Solubility = Water
- Storage Conditions = Ambient
- Description contains “Ginger ALE”
- Flavor Label = Natural, WONF
- GMO Status = Not Detectable
The system:
- automatically suggests values from available lists
- validates empty or incorrect fields
- allows multiple conditions to be added
- shows the number of matching results in real time
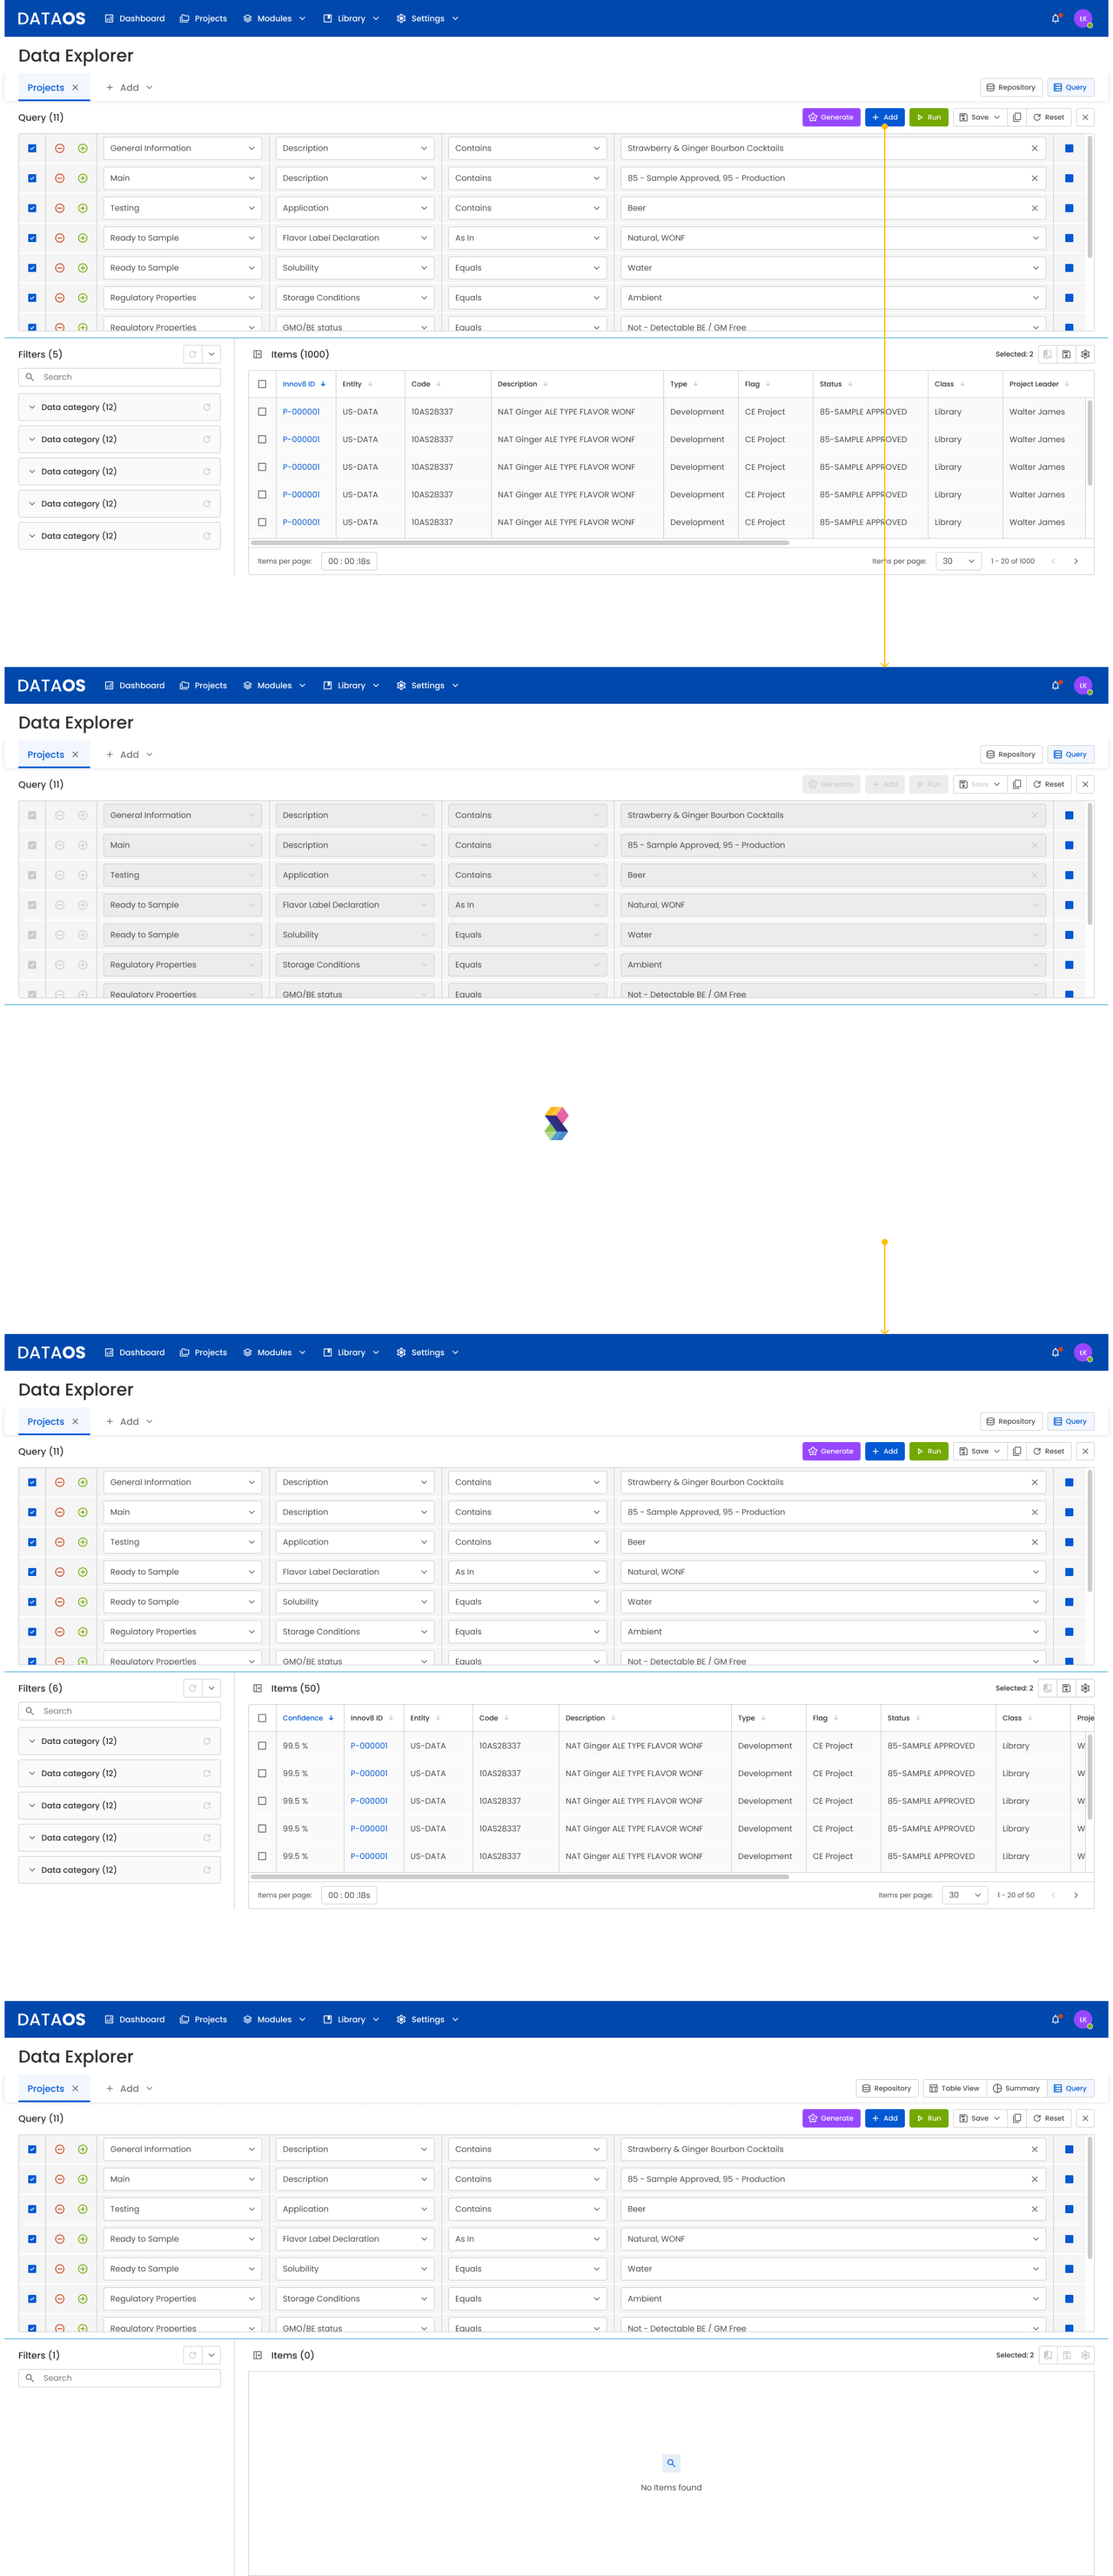
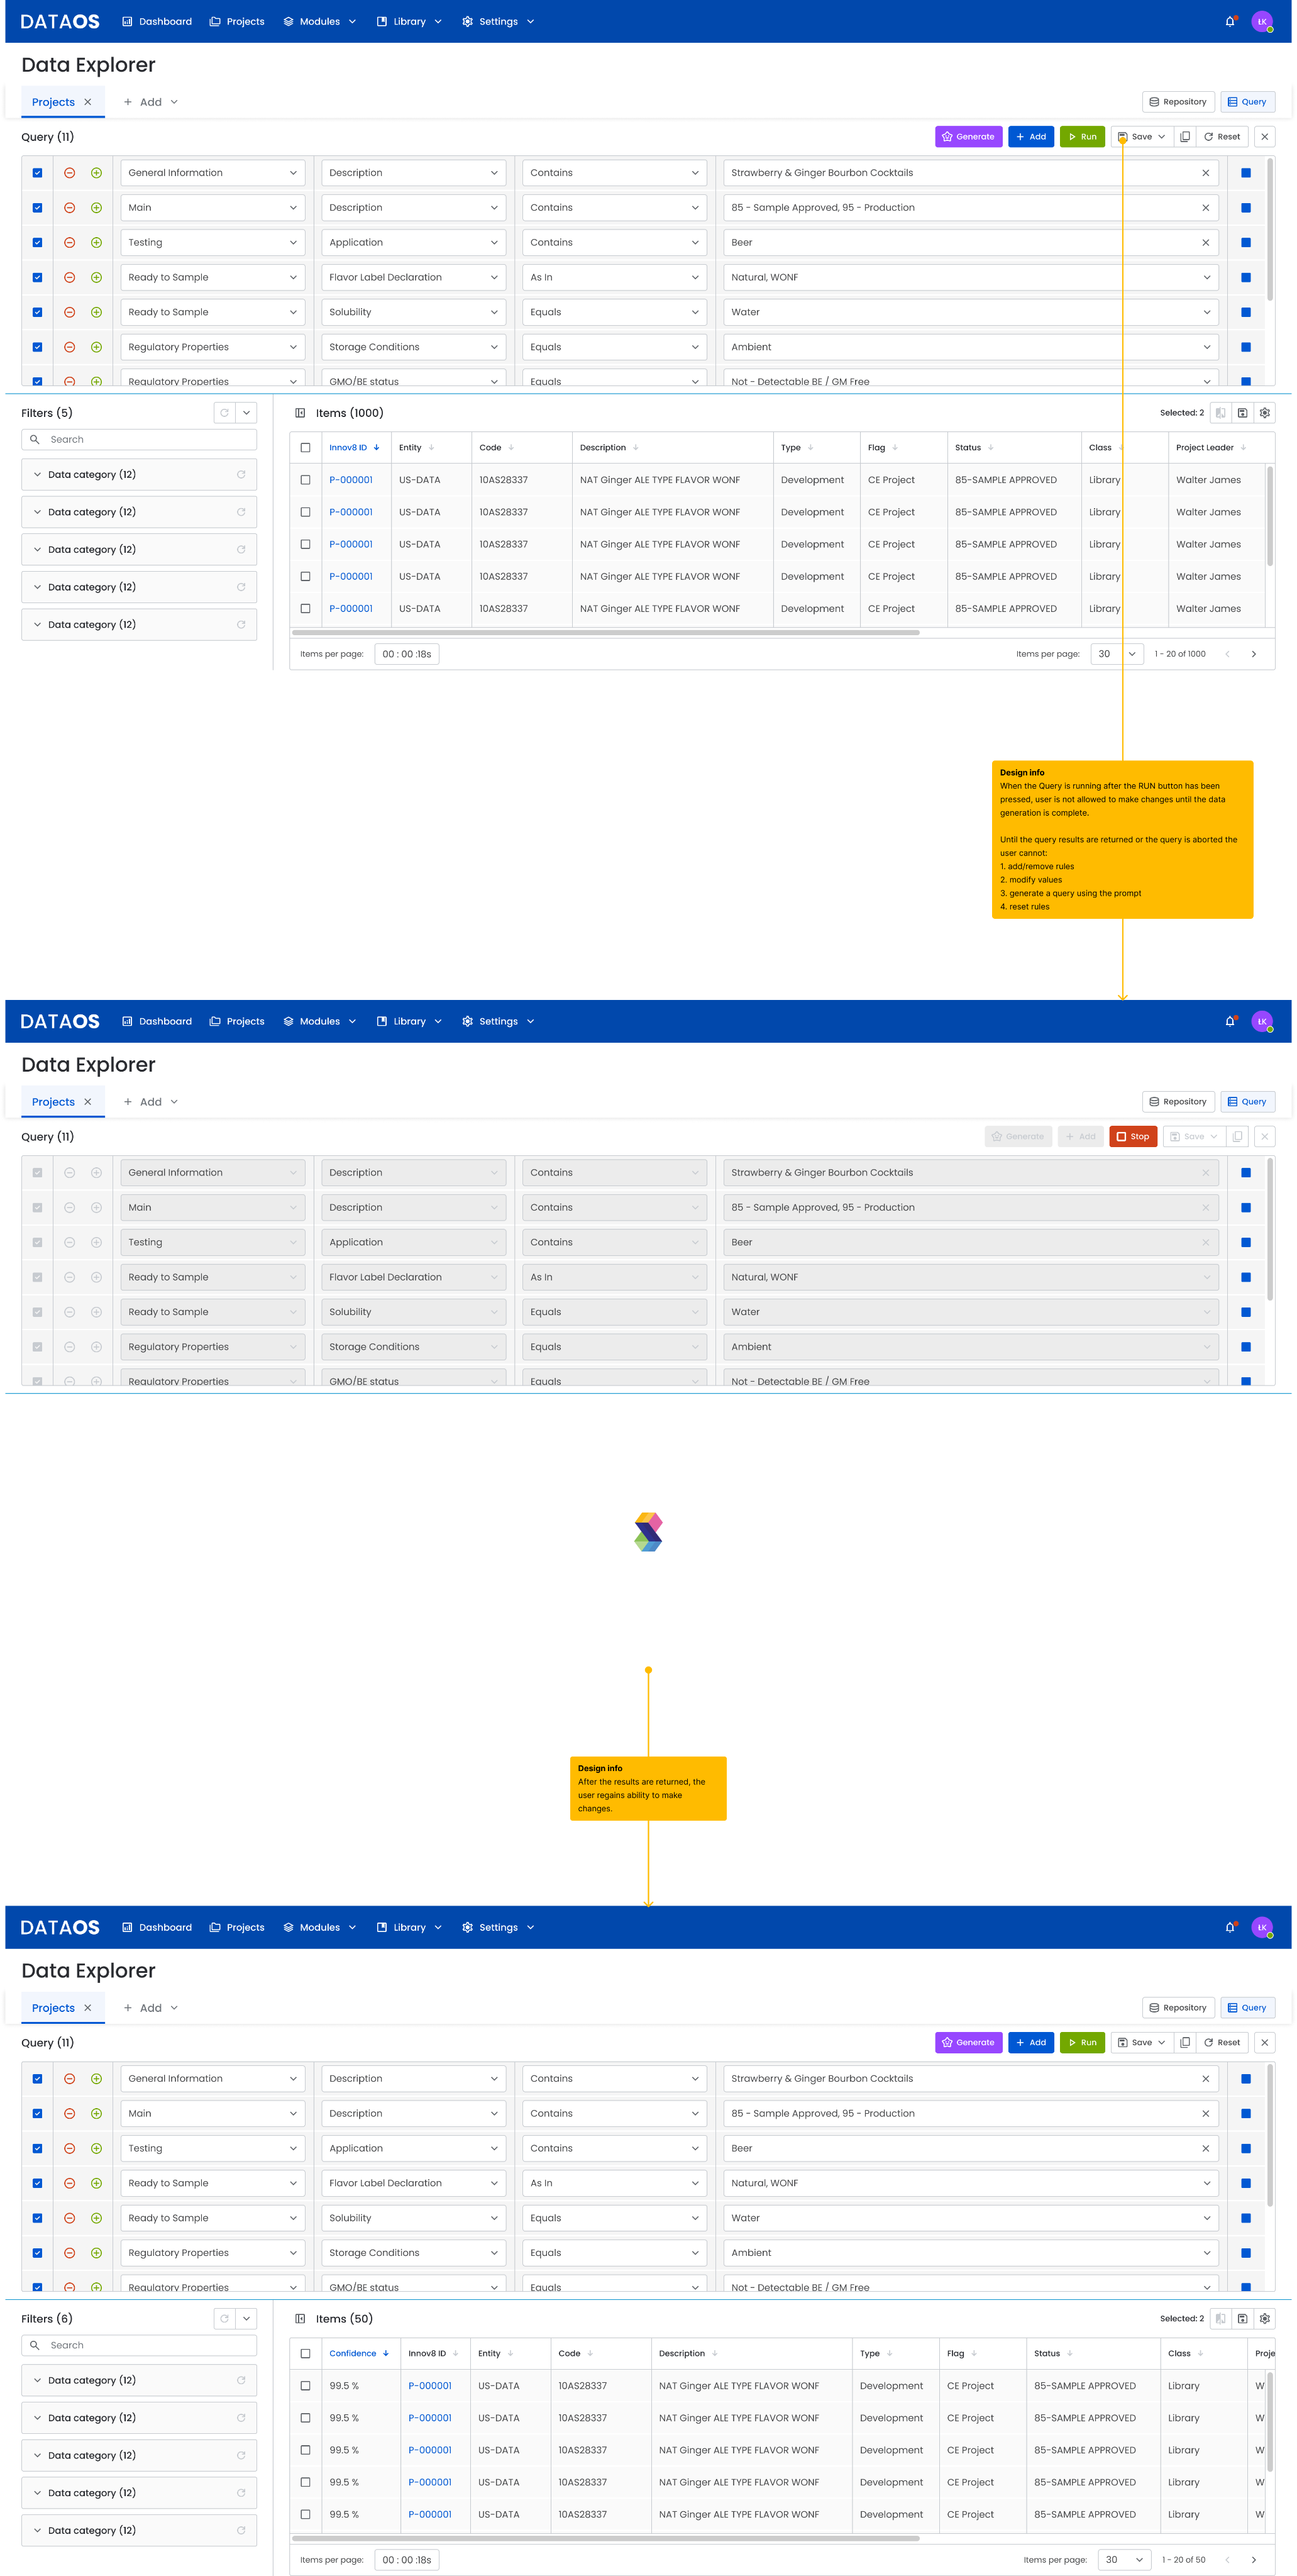
3.4 Running a query
After clicking Run:
- The interface becomes temporarily locked to prevent editing while the query is being processed. This ensures data consistency and input integrity and helps avoid errors.
- The system generates the results.
- Once processing is complete, editing becomes available again, as input data is no longer required for calculations and the user can safely modify filters or run a new query.
3.5 Saving and publishing a query
The user can:
- save the query privately using Save New Query
- publish it to other system users using Publish Query
The system enforces title uniqueness and notifies the user if a query with the same title already exists.
→This is because the title serves as the identifier for the query, enabling easy search, distinction, and management. Duplicate titles could lead to confusion, accidental overwrites, or difficulty finding specific queries in the system.
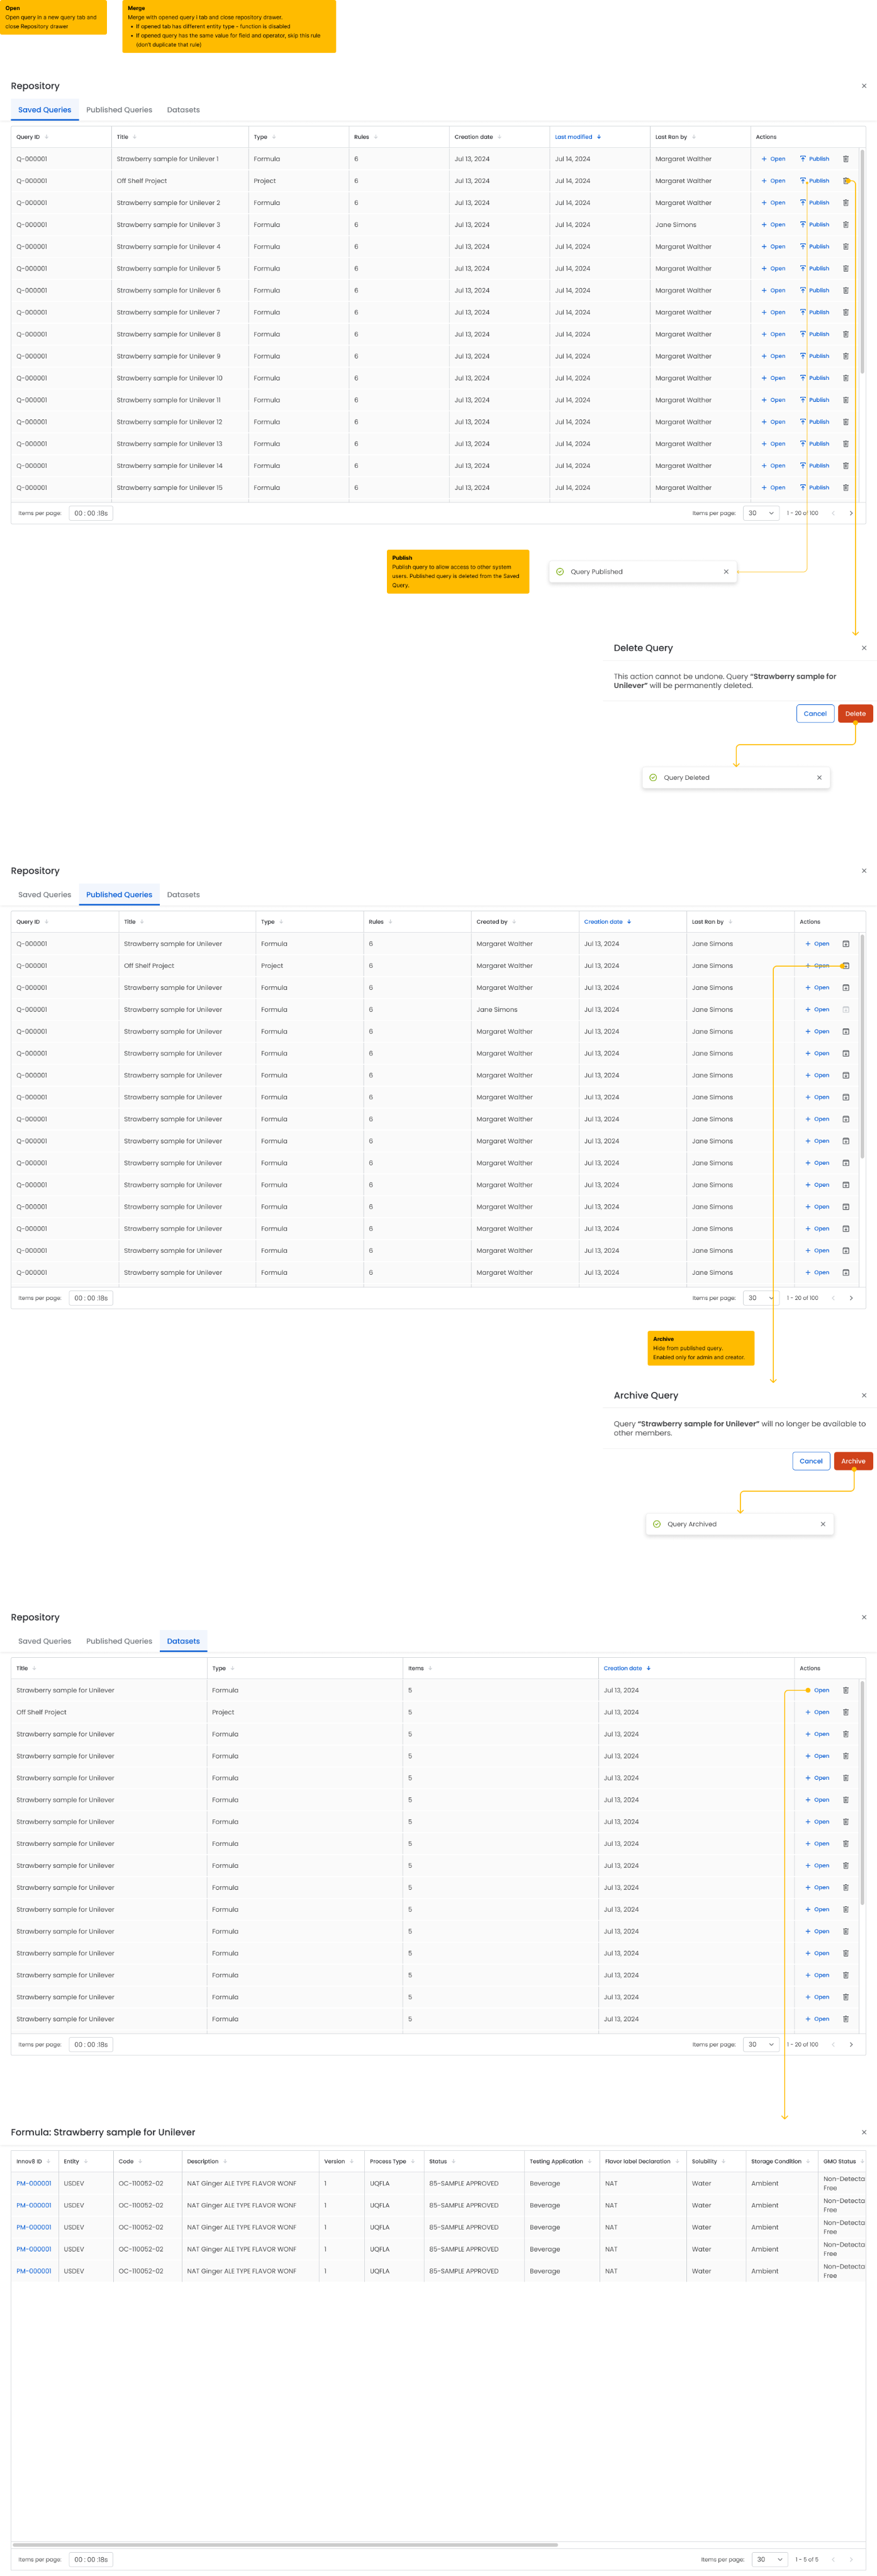
3.6 Query repository management
The user can:
- browse all saved and published queries
- open queries in new tabs
- merge queries with the current one
- archive or delete outdated queries
Example queries in the repository:
- Strawberry sample for Unilever
- Off Shelf Project
- 85-Sample Approved – Ginger
4. Results and business value
Results
- Data retrieval time reduced from 30 minutes to 2 minutes. This was achieved by introducing a visual query builder that automates filtering and data search, along with the ability to save and re-run queries without manually setting parameters each time.
- Queries can be reused. This saves time, reduces errors, and ensures consistency — users can repeatedly run verified queries across time periods or with adjusted parameters.
- Easier preparation of comparison tests and product samples for clients.
- Consistent data use across departments — all teams rely on the same filters and logic.
Benefits
- Increased productivity in R&D and Regulatory teams
- Reduction in manual errors
- Elimination of duplicate efforts across teams
- Improved data quality control
5. Summary
The Data Explorer project is an example of a user-centered analytics tool built for non-technical audiences. The key to its success was a combination of deep user research, clear UX, transparent logic, and knowledge sharing.
In-depth research
During the discovery phase, we conducted interviews and observed users from different departments. This revealed real barriers to data access, particularly the difficulty of repeating analyses and the dependency on technical teams. As a result, we designed a tool that directly addressed user challenges, leading to stronger engagement and adoption.
Clear UX
The interface was designed for non-technical users and guides them step by step through the query-building process. Clear labels, a limited number of options, and plain language allow users to work with data independently. By simplifying complex operations, the app significantly expanded access to analytics within the organization.
Transparent query logic and filters
Every query is presented in a clear and understandable format. Users can see which filters are active and what data will be retrieved. This increases trust in the results and makes it easier to review and explain findings within teams. Transparency also supports auditing and verification.
Shared knowledge through the query repository
Users can save and share queries, building a shared knowledge base. This speeds up work, promotes best practices, and aligns analytical approaches across the organization. The repository becomes a trusted source of proven solutions — especially valuable for onboarding new team members and launching analytical initiatives.
Takeaways
- Even advanced users prefer visual tools over manually working in Excel or SQL
- Without a shared knowledge base, teams duplicate work and produce inconsistent analyses
- Non-technical users can explore data independently when guided by a step-by-step interface and supported by visual feedback
- Transparent queries and visible logic build trust in data and facilitate team discussions
Lessons learned
- When designing tools for non-technical teams, focus on a simple, predictable interface and plain language
- True user needs often emerge through observation, not just interviews
- A built-in query repository is more than an organizational feature — it’s the foundation of a strong data culture
- Validating user actions in real time and providing immediate feedback reduces errors and frustration
- Scalable solutions do not have to be complex
Data Explorer
The challenge: How to make data accessible to non-technical teams without relying on IT support?
Scope of Work
A thoughtful application design process
→ Research
Market analysis, problem identification, goal definition, forecasting, competition analysis, user surveys, persona creation, empathy mapping
→ UX Design
User journeys, information architecture, flow maps, functional wireframes
→ UI Design
Color palette, typography, brand style, interface components
→ Project Review
Key elements, aesthetics, functionality
→ Testing
A/B testing, high-fidelity prototypes, final conclusions
Problem
Non-technical teams such as PM, R&D, and Regulatory had limited access to product data. They were unable to independently build queries or search through data without IT support. This caused delays, errors, duplicated work, and inconsistent analysis outcomes.
The need
To design a tool that supports intuitive data exploration without requiring SQL skills. It should allow users to save, validate, and share queries within a friendly interface that promotes autonomy and improves consistency.
My role
I was responsible for defining the problem and designing the Data Explorer application. Through user research, testing, and UX design, I created a solution that enables non-technical users to work effectively with data without technical barriers or BI team involvement.
1. Project goal
The organization needed a solution that would let non-technical users such as PMs, R&D, and Regulatory teams explore product data and build complex queries. These queries should be easy to save and share within the team, without requiring SQL knowledge or IT assistance.
2. Research and requirements definition
Research methods
- Five in-depth interviews with end users
- Observations of workflows using Excel and manual filtering
- Analysis of seventeen real-life query examples from spreadsheets and emails
Key user needs
- An intuitive interface for filtering data
- Ability to build complex logic using AND and OR
- Options to save and share queries
- Query history and version control
- Validation before running a query
Insights
- The absence of a shared repository led to repeated work
- Even experienced users preferred a click-based interface
- The lack of visual feedback during query building led to errors
3. Core features and user journey
3.1 Application start and data source selection
Users open the application from the main dashboard. They can either start exploring data from scratch or load it from a project or the shared query repository.
3.2 Default view (data table)
When the user opens the application, they see:
- a table with default results
- the ability to filter by columns such as Flavor Type, Status, or Project
- basic exploration tools available immediately
3.3 Manual query creation
The user clicks “Add Query” to build a filter. Example rules include:
- Solubility = Water
- Storage Conditions = Ambient
- Description contains “Ginger ALE”
- Flavor Label = Natural, WONF
- GMO Status = Not Detectable
The system:
- automatically suggests values from available lists
- validates empty or incorrect fields
- allows multiple conditions to be added
- shows the number of matching results in real time
3.4 Running a query
After clicking Run:
- The interface becomes temporarily locked to prevent editing while the query is being processed. This ensures data consistency and input integrity and helps avoid errors.
- The system generates the results.
- Once processing is complete, editing becomes available again, as input data is no longer required for calculations and the user can safely modify filters or run a new query.
3.5 Saving and publishing a query
The user can:
- save the query privately using Save New Query
- publish it to other system users using Publish Query
The system enforces title uniqueness and notifies the user if a query with the same title already exists.
→This is because the title serves as the identifier for the query, enabling easy search, distinction, and management. Duplicate titles could lead to confusion, accidental overwrites, or difficulty finding specific queries in the system.
3.6 Query repository management
The user can:
- browse all saved and published queries
- open queries in new tabs
- merge queries with the current one
- archive or delete outdated queries
Example queries in the repository:
- Strawberry sample for Unilever
- Off Shelf Project
- 85-Sample Approved – Ginger
4. Results and business value
Results
- Data retrieval time reduced from 30 minutes to 2 minutes. This was achieved by introducing a visual query builder that automates filtering and data search, along with the ability to save and re-run queries without manually setting parameters each time.
- Queries can be reused. This saves time, reduces errors, and ensures consistency — users can repeatedly run verified queries across time periods or with adjusted parameters.
- Easier preparation of comparison tests and product samples for clients.
- Consistent data use across departments — all teams rely on the same filters and logic.
Benefits
- Increased productivity in R&D and Regulatory teams
- Reduction in manual errors
- Elimination of duplicate efforts across teams
- Improved data quality control
5. Summary
The Data Explorer project is an example of a user-centered analytics tool built for non-technical audiences. The key to its success was a combination of deep user research, clear UX, transparent logic, and knowledge sharing.
In-depth research
During the discovery phase, we conducted interviews and observed users from different departments. This revealed real barriers to data access, particularly the difficulty of repeating analyses and the dependency on technical teams. As a result, we designed a tool that directly addressed user challenges, leading to stronger engagement and adoption.
Clear UX
The interface was designed for non-technical users and guides them step by step through the query-building process. Clear labels, a limited number of options, and plain language allow users to work with data independently. By simplifying complex operations, the app significantly expanded access to analytics within the organization.
Transparent query logic and filters
Every query is presented in a clear and understandable format. Users can see which filters are active and what data will be retrieved. This increases trust in the results and makes it easier to review and explain findings within teams. Transparency also supports auditing and verification.
Shared knowledge through the query repository
Users can save and share queries, building a shared knowledge base. This speeds up work, promotes best practices, and aligns analytical approaches across the organization. The repository becomes a trusted source of proven solutions — especially valuable for onboarding new team members and launching analytical initiatives.
Takeaways
- Even advanced users prefer visual tools over manually working in Excel or SQL
- Without a shared knowledge base, teams duplicate work and produce inconsistent analyses
- Non-technical users can explore data independently when guided by a step-by-step interface and supported by visual feedback
- Transparent queries and visible logic build trust in data and facilitate team discussions
Lessons learned
- When designing tools for non-technical teams, focus on a simple, predictable interface and plain language
- True user needs often emerge through observation, not just interviews
- A built-in query repository is more than an organizational feature — it’s the foundation of a strong data culture
- Validating user actions in real time and providing immediate feedback reduces errors and frustration
- Scalable solutions do not have to be complex